Reporting Guide
Build a Weekly Client Report From Real Data
A weekly report should answer one question: is the phone ringing more than before we started? Pull four real numbers, compare them to a baseline set before any work, and send it on a schedule without anyone pressing a button.
- Year 1Website
- Year 2Map Listings
- Year 3Booking Tool
- Year 4Front Desk
- Year 5Payments
- Year 6Reports
Same six pieces.
Years of lessons, one read.
Free to read. Most of this guide is open. The finishing pieces at the end come to you when you opt in.
The Short Version
- Use four sources: Search Console, GA4, call tracking and jobs booked.
- Set the baseline before any work starts. You cannot set it later.
- Show movement against the baseline, not big totals.
- Say missing when a number is missing. Never show it as zero.
- Send it on a schedule, and alarm if it did not send.
What the Report Is For
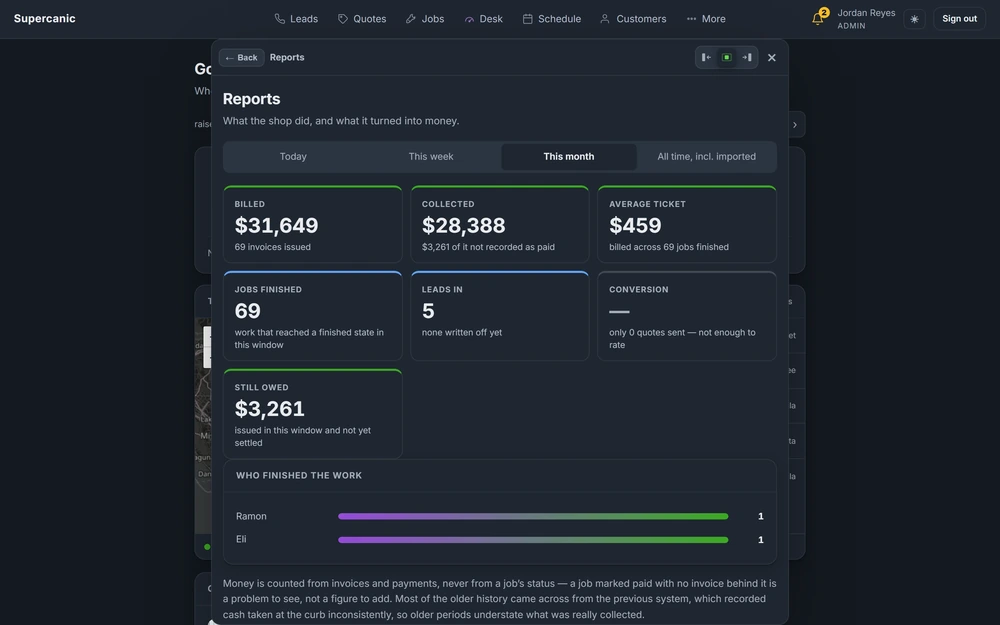
An owner does not want a dashboard. They want to know if the money they spend with you is bringing in work. Every number in the report should help answer that. If a number does not, cut it.
That rules out most of what reporting tools show by default. Total page views, bounce rate, average time on page and follower counts all look busy and answer nothing. A report full of them teaches the owner to stop reading.
Four numbers, in order from first touch to paid work, tell the whole story.
- Search clicks and impressions from Google Search Console. Are more people seeing and choosing the business in search?
- Sessions and key events from GA4. Are those visits turning into form sends, calls and bookings on the site?
- Calls from call tracking. How many real calls came in, and how many were from new people?
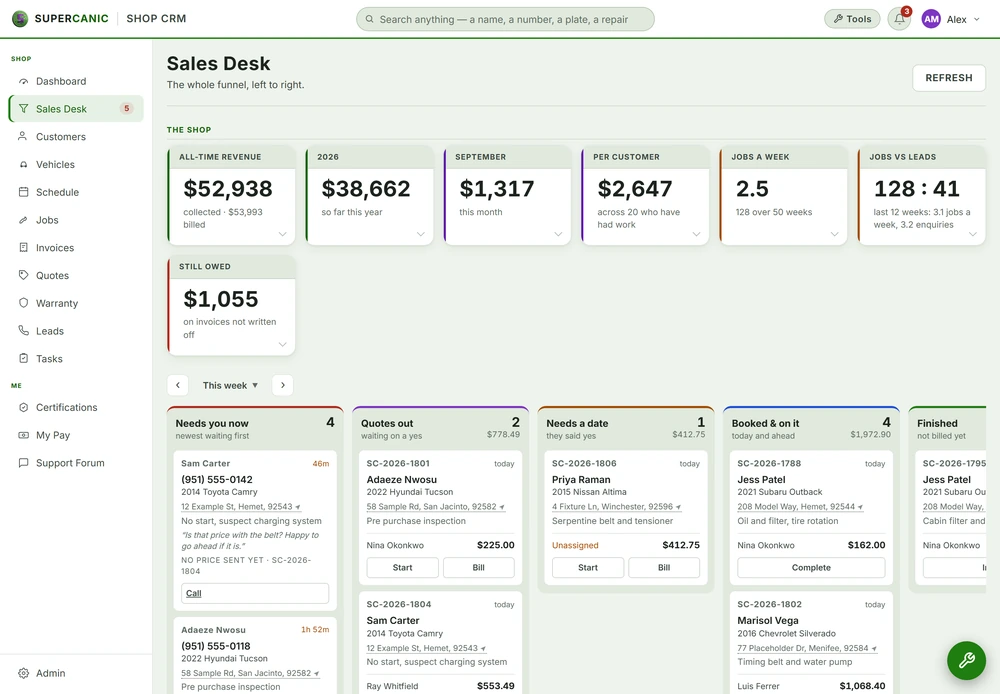
- Jobs booked from the business's own system. Did the calls become work?
If the first number goes up and the last does not, something between them is broken. That is the report doing its job.
Set the Baseline Before Work Starts
The baseline is what normal looked like before you touched anything. Without it, every number is just a number. With it, every number is a change you can explain.
Capture it before the first change goes live. Say you start work on the first of the month. Pull the four weeks before that date for all four sources, and save the weekly average of each. Write down the date you pulled it and the date work started.
Set it before work, because you cannot set it after. Once your first change is live, any window you pick includes your own work, and the baseline flatters you. Owners notice that, and it costs trust you will not get back.
Store the baseline as data, not as a line in an email. The report reads from it every week. It never changes. If the business changes in a big way, like a second location, set a new baseline, keep the old one, and say so in the report.
Pull Search Console and GA4
Both Google tools have free APIs. Set up a service account in Google Cloud, add its email as a user on the Search Console property and the GA4 property, and point your script at its key with the GOOGLE_APPLICATION_CREDENTIALS setting.
from googleapiclient.discovery import build
from google.analytics.data_v1beta import BetaAnalyticsDataClient
from google.analytics.data_v1beta.types import DateRange, Metric, RunReportRequest


def search_console(site, start, end):
    gsc = build('searchconsole', 'v1')
    body = {'startDate': start, 'endDate': end}
    rows = gsc.searchanalytics().query(siteUrl=site, body=body).execute().get('rows', [])
    if not rows:
        return None
    return {'clicks': rows[0]['clicks'], 'impressions': rows[0]['impressions']}


def ga4(property_id, start, end):
    req = RunReportRequest(
        property=f'properties/{property_id}',
        date_ranges=[DateRange(start_date=start, end_date=end)],
        metrics=[Metric(name='sessions'), Metric(name='keyEvents')],
    )
    rows = BetaAnalyticsDataClient().run_report(req).rows
    if not rows:
        return None
    vals = [float(v.value) for v in rows[0].metric_values]
    return {'sessions': vals[0], 'key_events': vals[1]}


print(search_console('sc-domain:example.com', '2026-09-21', '2026-09-27'))
print(ga4('123456789', '2026-09-21', '2026-09-27'))
Note the None. When a source returns nothing, the function says so. It does not return zero. A zero in the report would tell the owner their traffic died. A missing value tells them the data did not arrive, which is a different problem with a different fix.
Key events are the GA4 events you marked as important, like a form send or a tap on the phone number. Decide which ones count before you set the baseline, and do not change the list without saying so.

Add Calls and Jobs Booked
Calls come from your call tracking tool, like CallRail. Most export calls through an API or a CSV. Count three things for the week: all calls, answered calls, and first time callers. First time callers are the best sign of new business, because repeat callers are often existing customers asking about a job.
Leave out calls under a short cut off, like 30 seconds, as a labeled rule in the report. Wrong numbers and hang ups are not leads.
Jobs booked come from wherever the business keeps its work, like a shop system or a CRM. Count jobs created in the week, not jobs finished, so the number lines up with the calls that caused them. If you can, count only jobs from new customers too.
Jobs booked is the number the owner cares about most. It is also the one most reports leave out, because it lives outside the marketing tools. Fight to get it. Without it, you are reporting on the path and never the destination.
Show Movement, Not Totals
For each number, show three things: this week, the baseline, and the change as a percent. That is it.
| Measure | This week | Baseline | Change |
|---|---|---|---|
| Search clicks | 118 | 84 | up 40% |
| Key events | 21 | 15 | up 40% |
| First time calls | 17 | 14 | up 21% |
| Jobs booked | 12 | 11 | up 9% |
That table is a made up example. Read it the way an owner would. Search and site activity are up a lot. Calls are up some. Jobs are up a little. The gap says the phone is ringing more but fewer calls become jobs. That is a question for the front desk, and it is worth more than any chart.
Add one plain sentence at the top that says what changed and why you think so. Add one line that says what you did that week. Keep it short enough to read on a phone.
Leave out the numbers that only look good. A jump in impressions from a search term that brings no calls is noise. A rise in sessions from one blog post that ranks far from the service area is noise too. If a number went up and nothing below it moved, say that plainly rather than leading with it. The owner will trust the good weeks more because you were honest about the empty ones.
Weekly numbers bounce. One slow week is not a trend. Show a four week trend line beside the table if the owner likes charts, and never call a single week a win or a loss.
Send It Without Pressing a Button
A report that needs someone to remember to send it will stop being sent. Run it on a schedule. Monday mornings are common, but Search Console data runs a few days behind. Report the week that ended at least three days ago, or run it midweek, so the search numbers are complete.
Run the job on a server, not on a laptop. Send it through your email tool's API to the owner. Then make the job print one line saying who it went to and what it sent, and alarm if that line is missing on report day. Our guide to scheduled jobs that actually run covers how.
What the Finishing Pieces Contain
You can build a working report from what is above. The finishing pieces give you the email template we send, word for word, the code that works out the change against the baseline and handles missing data, and the edge cases that make numbers lie, like date lag, time zones and a GA4 event that got renamed. They end with the checklist we run before the first report goes out. Next, see what we show owners in our reporting dashboard build.
The finishing pieces
Get the Rest of This Guide
You have the method. The finishing pieces are the parts you copy straight into your own work:
- The Weekly Email Template
- Working Out the Change, With Missing Data
- Edge Cases That Make Numbers Lie
- Checklist Before the First Report Goes Out
Questions People Ask
What should a weekly marketing report include?
Search clicks and impressions, site sessions and key events, calls from new people, and jobs booked. Show each against a baseline set before work started.
Why do I need a baseline before work starts?
Without it you cannot tell your results from normal. Any window you pick after work starts includes your own changes and makes the numbers look better than they are.
Why do my Search Console numbers drop at the end of the week?
Search Console data runs a few days behind. Report on a week that ended at least three days ago so the numbers are complete.
What if one data source fails to report?
Show it as missing, never as zero. If most sources are missing, hold the report and fix the source before sending.
Keep Going
Build · ReportingThe Reporting Dashboard That Writes Its Own Reports
Our reporting dashboard puts calls, rankings and jobs on one screen. It scores each milestone with impact points and sends the daily, weekly and monthly reports by itself, so nobody spends Monday building a slide deck.
Read itReporting LayerAnalytics and Reporting
We pull GA4, Search Console, call tracking and your job records into one dashboard, so a visit can be traced to a call and a call to a job. A plain report lands every week and every month without anyone asking for it.
Read itFree guideIndexing GuideSet Up Search Console, Bing Webmaster and IndexNow
Verify your whole domain in Google Search Console with one DNS record, add it to Bing Webmaster Tools, submit a sitemap and send changed pages to IndexNow. This guide includes a working IndexNow script that uses only Python's standard library.
Read itWe sell time
Get Years of Building Switched On in Hours
A thirty minute call. A written price. Nothing built until you say yes.