Avenue 7 of 8
Reporting That Shows What Actually Happened
You get one dashboard and one short weekly report. Both are built from your real data, and both tell you what is not working as plainly as what is.
- Year 1Website
- Year 2Map Listings
- Year 3Booking Tool
- Year 4Front Desk
- Year 5Payments
- Year 6Reports
Same six pieces.
Switched on in one day.
The Short Version
- One screen for search, calls, leads and reviews
- A weekly report in plain words, not a pile of charts
- Numbers come from Google Search Console, GA4 and your phone line
- The report says what is not working and what we are doing about it
- Your login only shows your business
| Search data | Google Search Console |
|---|---|
| Site data | GA4 |
| Calls and leads | CallRail and the CRM |
| Delivery | Dashboard plus weekly email |
| Access | Your own login, your data only |
- SourcesSearch ConsoleGA4CallsReviews
- CollectDaily pullStored per business
- CheckBaseline setGaps flagged
- ShowDashboardWeekly report
- YouRead in five minutes
Where the Hours Go Today
Here is an example week for an owner trying to find out if his marketing works.
- Monday. He logs into Google Analytics. He cannot find the number he looked at last month.
- Tuesday. His marketing company sends a report. It is twelve pages of charts that all go up. He does not know what any of them mean for his phone.
- Wednesday. He asks the front desk how many new customers came in. Nobody tracked it.
- Thursday. He checks his Google profile and sees two new reviews he did not know about.
- Friday. He still does not know if the money he spent last month did anything.
Data is everywhere. Answers are not. And a report that only shows good news is not a report. It is a sales pitch.
What We Run Instead
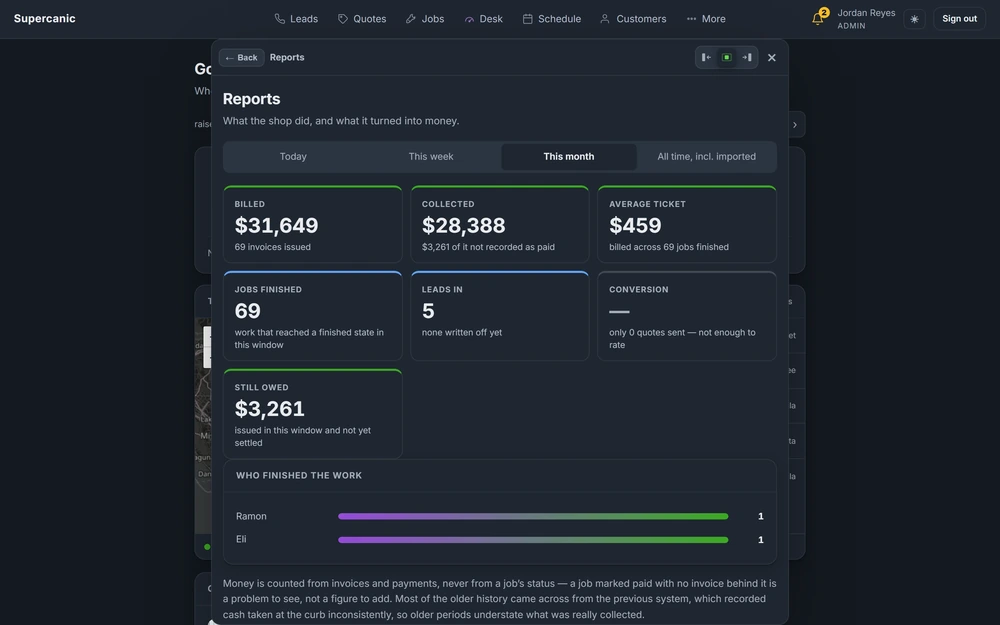
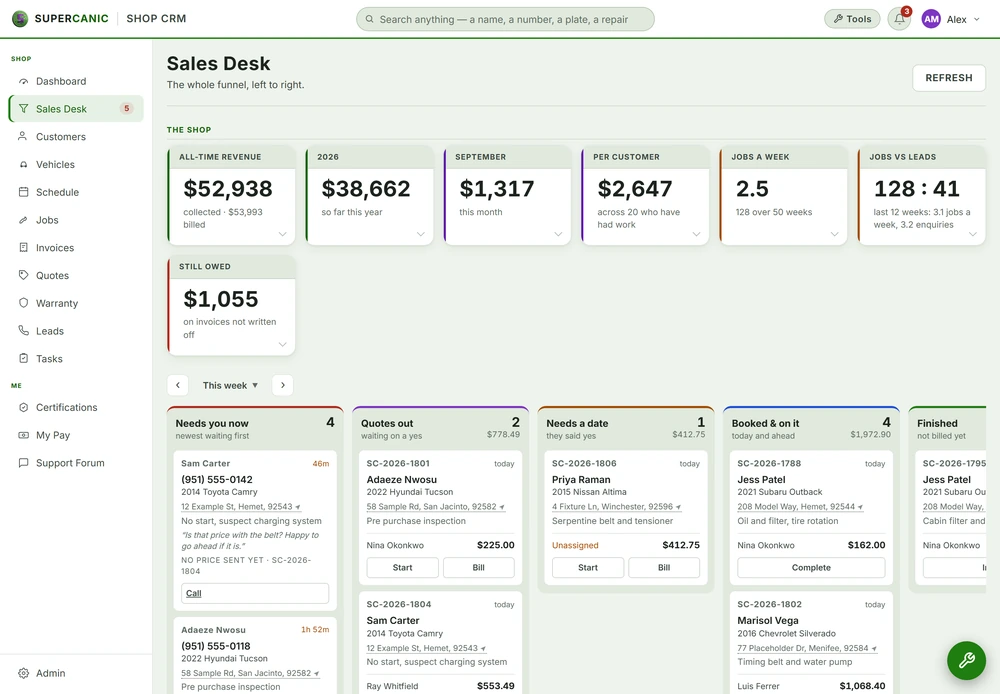
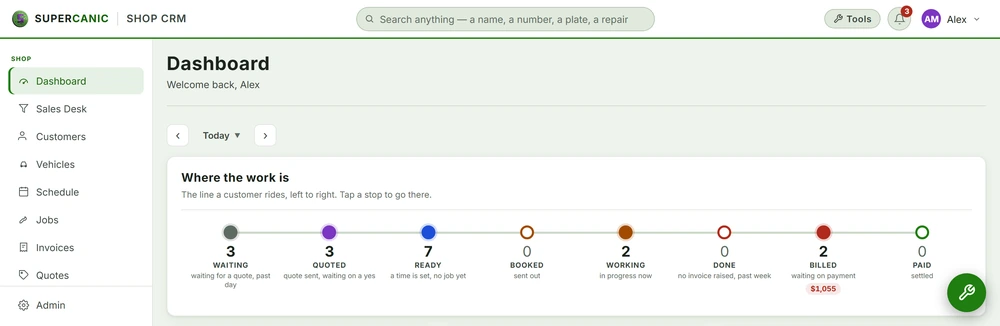
You get one dashboard. It shows how people found you, which pages they read, how many called or texted, and what reviews came in. Each number says where it came from.
Once a week you get a short report in plain words. It says what changed, what worked, and what did not. It says what we are doing next. You can read it in five minutes.
The report is honest about the slow parts. If a city page has not been picked up by Google yet, it says so. If calls dipped, it says so and says what we think the reason is. If we do not know the reason, it says that too.
We also track milestones. The first time a new page shows up in search. The first call from a tracked number. The first review from a review ask. These are the small signs that the work is taking hold, well before the big numbers move.
The Stack Underneath
The dashboard is the same one we use to watch our own network. The reporting dashboard build page shows how it came together. The data side is on the analytics and reporting page.
- Google Search Console tells us what people searched and which pages Google showed.
- GA4 tells us what people did on your site.
- CallRail and the CRM tell us who called, texted or filled a form.
- A daily job pulls it all and stores it per business.
Each business's data is walled off in the database, not just hidden on the screen. Your login only sees yours. See Postgres and row level security.
We also watch for a trap that fools a lot of reports. If the starting number is wrong, every change after it looks bigger or smaller than it is. We set the baseline from real data before we report any change.
We also track visits from AI answer engines like ChatGPT and Claude, using your real GA4 data. Our guide on AI search traffic in GA4 shows the setup.
What the Weekly Report Says
Every report follows the same shape, so you know where to look:
- What happened. Calls, texts, forms and reviews this week, next to last week.
- How people found you. Top searches and top pages.
- What worked. The page, profile change or message that did the most.
- What did not. Pages not indexed, messages that did not send, numbers that fell.
- What we are doing next. One or two things, not ten.
Here is how the "what did not" part might read in an example week for a shop:
Your new page for the next town over is still not in Google. It was sent on Monday. Pages like this often take a week or two. If it is not in by next Friday, we will check it for problems and send it again.
That is the tone of the whole report. It names the page, says what we did, says what is normal, and says what we will do if normal does not happen. No charts you have to squint at to find the bad news.
If you want to build a report like this for your own clients, our guide on the weekly client report shows how.
What Switching It On Looks Like
- Hour 1. We talk about what you want to know each week. Calls? Booked jobs? Reviews?
- Hour 2. You give us access to Search Console and GA4, or we set them up for you.
- Hour 3. We connect your phone line, tracking numbers and CRM.
- Hour 4. The first pull runs. We check that every number matches its source.
- Hour 5. We set your baseline and your milestones.
- Hour 6. You get your login and walk through the dashboard with us. The first weekly report comes at the end of the week.
What We Will Not Promise
We will not promise that every chart goes up. Some weeks are slow. The report will say so.
We will not mix in numbers we cannot trace to a source. If a number is an estimate, it says estimate.
We will not count a lead twice to make a week look better.
To see what all of this runs on, go to hosting and IT.
Questions People Ask
Where do the numbers come from?
Google Search Console, GA4, your phone line and your CRM. Each number on the dashboard says which one it came from.
Will the report tell me when something is not working?
Yes. Every report has a section for what did not work and what we are doing about it.
Can anyone else see my data?
No. Each business's data is walled off in the database, and your login only shows yours.
How long does the weekly report take to read?
About five minutes. It is short on purpose.
Keep Going
Build · ReportingThe Reporting Dashboard That Writes Its Own Reports
Our reporting dashboard puts calls, rankings and jobs on one screen. It scores each milestone with impact points and sends the daily, weekly and monthly reports by itself, so nobody spends Monday building a slide deck.
Read itReporting LayerAnalytics and Reporting
We pull GA4, Search Console, call tracking and your job records into one dashboard, so a visit can be traced to a call and a call to a job. A plain report lands every week and every month without anyone asking for it.
Read itFree guideReporting GuideBuild a Weekly Client Report From Real Data
A weekly report should answer one question: is the phone ringing more than before we started? Pull four real numbers, compare them to a baseline set before any work, and send it on a schedule without anyone pressing a button.
Read itFree guideAnalytics GuideMeasure Traffic From ChatGPT, Perplexity, Claude and Gemini in GA4
GA4 already records the visits AI tools send you, filed under Referral. Add a custom channel group with one regex and you can see those visits by engine, by landing page and by whether they turned into calls or bookings.
Read itWe sell time
Get Years of Building Switched On in Hours
A thirty minute call. A written price. Nothing built until you say yes.